

Mesurez précisément la déperdition d’utilisateurs dans les parcours de votre chatbot
Botnation propose des statistiques par défaut dans l’onglet dédié (nombre d’utilisateurs, nombre de messages, messages sans réponse) et des métriques personnalisées : les tags de tracking.
Nous venons de lancer un outil vous permettant d’aller encore plus loin dans vos mesures d’audience, les entonnoirs de conversion, que l’on nomme également les funnels.
1. Qu’est-ce qu’un entonnoir de conversion ?
Par exemple, votre chatbot contient un volet de collecte de leads demandant les champs suivants, dans l’ordre :
1) Nom
2) Email
3) Téléphone
Un tag de tracking placé en fin de formulaire (champs téléphone) vous permettra de connaître le nombre d’utilisateurs étant arrivés jusqu’à la fin.
Seulement, cela ne vous permet pas de mesurer l’audience perdue en cours de route et comparer les utilisateurs en fin de formulaire et ceux l’ayant démarré, pour en tirer les bonnes conclusions :
- supprimer les séquences superflues
- raccourcir le funnel
- améliorer le formulaire
- établir des statistiques précises
- etc
C’est là que les entonnoirs de conversation interviennent !
Le principe est simple : il s’agit de choisir au minimum 2 séquences qui se suivent, attendre qu’elles enregistrent des utilisateurs et observer leur comportement.
2. Comment implémenter ces tunnels de conversion ?
Pour cela, choisissez le chatbot sur lequel vous souhaitez implémenter ces funnels et rendez-vous dans l’onglet « Statistiques »
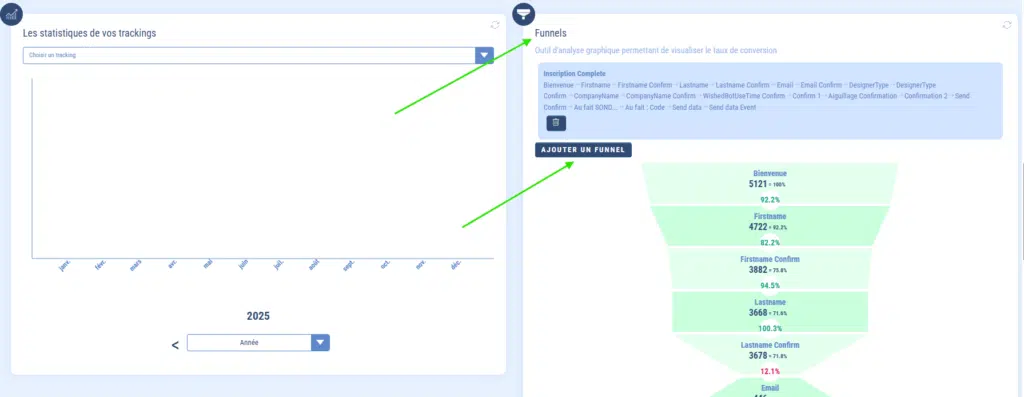
Déroulez la page des statistiques jusqu’à arriver en bas de page dans l’encart « Funnels ». Cliquez sur « Ajouter un funnel ».
Nommez-le, choisissez la séquence de départ (dans notre exemple, cela serait « Nom », soit la première) :
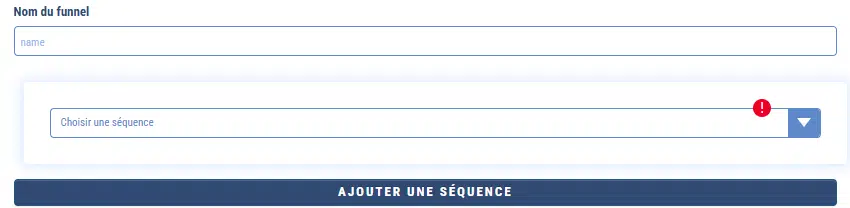
Puis, choisissez la seconde séquence (seules les séquences suivantes vous seront proposées), ici : « Email », puis la dernière, « Téléphone », et sauvegardez.
Votre funnel est prêt et s’affiche dans la liste. Vous pouvez en créer autant que vous le souhaitez et les supprimer via le logo poubelle. Les séquences mesurées s’affichent sous le nom du funnel.
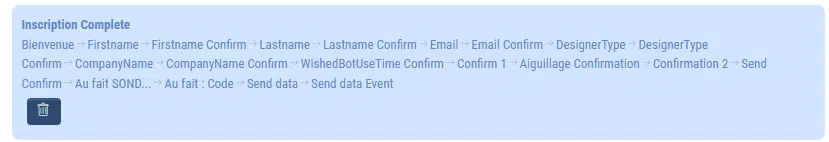
Une fois que vous enregistrez du trafic, cliquez n’importe où sur le cartouche et l’entonnoir apparaît :
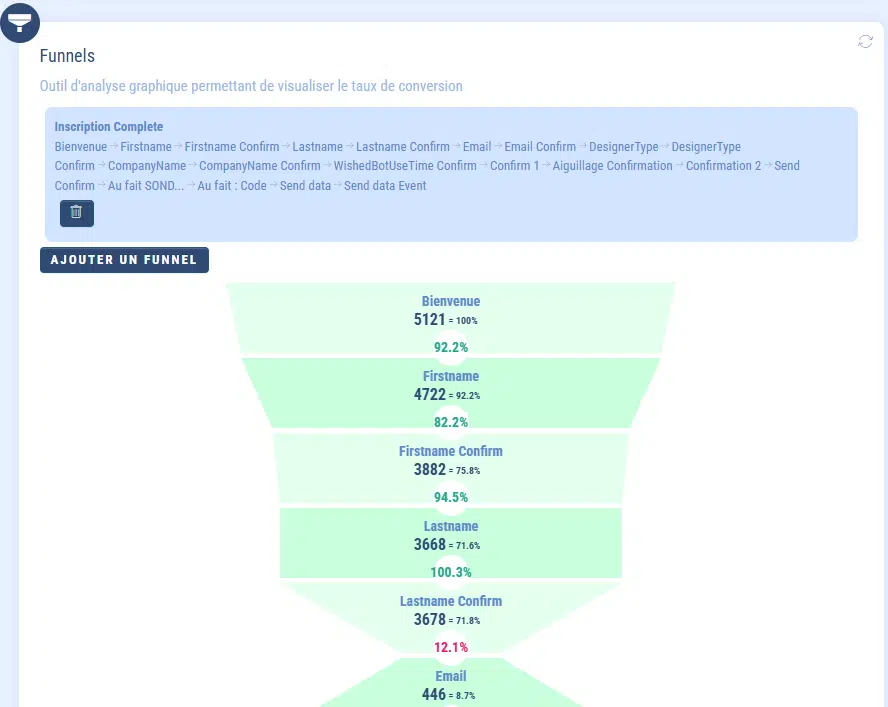
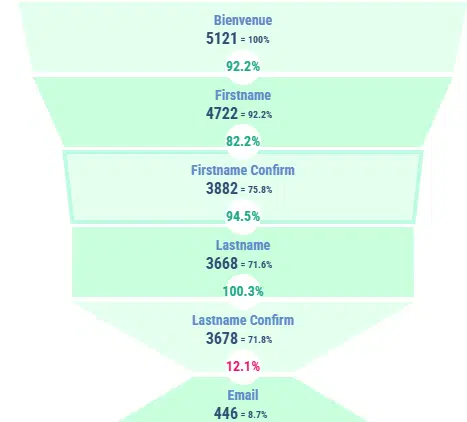
Vous pouvez choisir la période voulue pour avoir des mesures antérieures. Sous le nom de chaque séquence s’affiche le nombre d’utilisateurs arrivés dessus ainsi que le pourcentage par rapport à la séquence précédente.
3. Comment interpréter les résultats des funnels ?
Dans la capture ci-dessus, « Bienvenue » = 5121 utilisateurs, donc 100% car il s’agit de la première étape.
Ensuite « Firstname » n’enregistre que 4722 visiteurs, donc 399 utilisateurs ont quitté le chemin en cours. Cela représente donc 92,2% des visiteurs par rapport à la séquence précédente.
Puis, 3882 internautes se sont dirigés vers la séquence suivante, cela représente donc 82,2% par rapport à l’étape précédente, mais 75,8% du total de départ.
On remarque qu’e lors du passage de ‘à l’étape « Lastname Confirm », seul 446 utilisateurs arrivent jusqu’à « Email ». Cela correspond à 12,1% (indiqué en rouge), mais représente 8,7% du total de départ.
Vous savez dorénavant que seuls 8,7% des users arrivent jusqu’à « Email » et que la plus grosse déperdition se passe entre la séquence « Lastname Confirm » et « Email ». À vous d’en tirer les conclusions 😉 comme par exemple, améliorer le wording ou supprimer une étape.
À vous de jouer !
En plus :
– Les statistiques de votre chatbot
– Les tags de tracking