
How do you know if your chatbot is performing well? Does it meet the needs of users? And above all, how to improve it? We will see below a list of essential performance indicators and where to find them on our platform.
VOLUME OF ACTIVITY
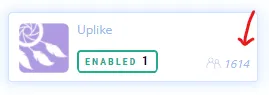
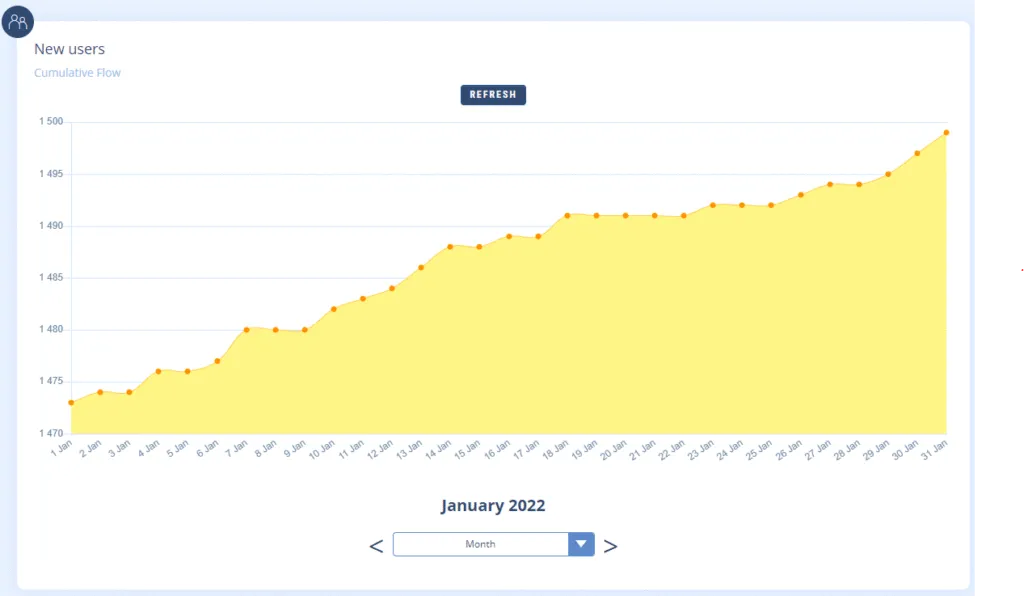
The number of unique users of your chatbot is the first performance indicator of your chatbot.
The cumulative total is visible from the dashboard on the cartridge of your chatbot.
You can see its evolution by day / week / month / year in the Statistics tab.
This is where you can see if an advertising campaign or chatbot improvements have had the desired impact.
INTERACTION RATE
What we are trying to analyze here is user engagement. On Botnation this is shown by the graph of the volume of incoming and outgoing messages from your chatbot in the Statistics tab.
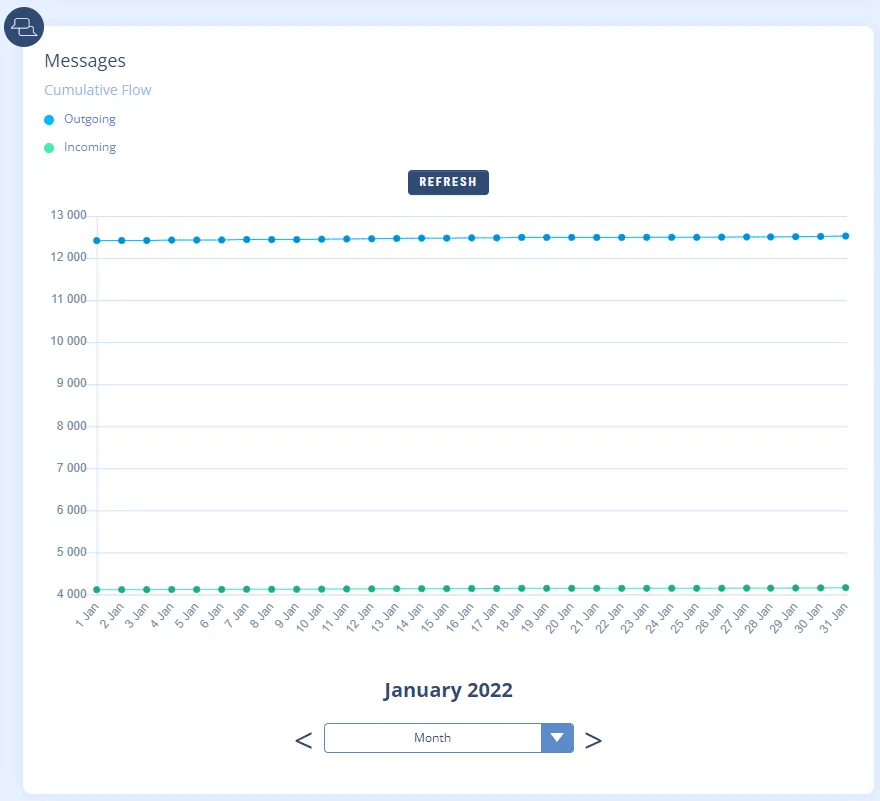
The ratio between these two indicators is variable depending on the nature of your chatbot (some are more talkative than others). What matters most is that they evolve in a constant and regular way.
TRANSFORMATION RATE
It is about measuring the success rate of a given action, whether it is the visit of a sequence, the simple click of a button or the completion of a form.
Buttons and Quick Replies
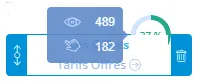
To identify whether a button has been clicked, Botnation offers statistics directly visible in the build interface. You will know the performance of each button or quick response: number of views and clicks.
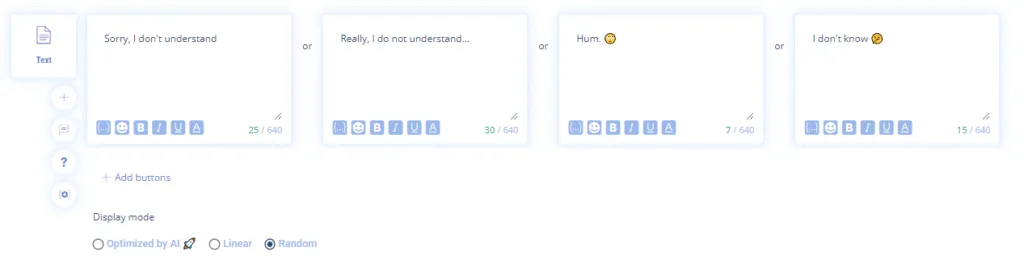
To improve the performance of a button you can use Botnation’s AB Testing features by pitting multiple BOMs against each other and/or changing the display order. You can then compare and optimize yourself or let the chatbot do it automatically with the option “Optimized by AI. This also works with carousels.
► Learn more about A/B Testing
Sequences
In the construction interface you will also find the number of visits of a sequence.
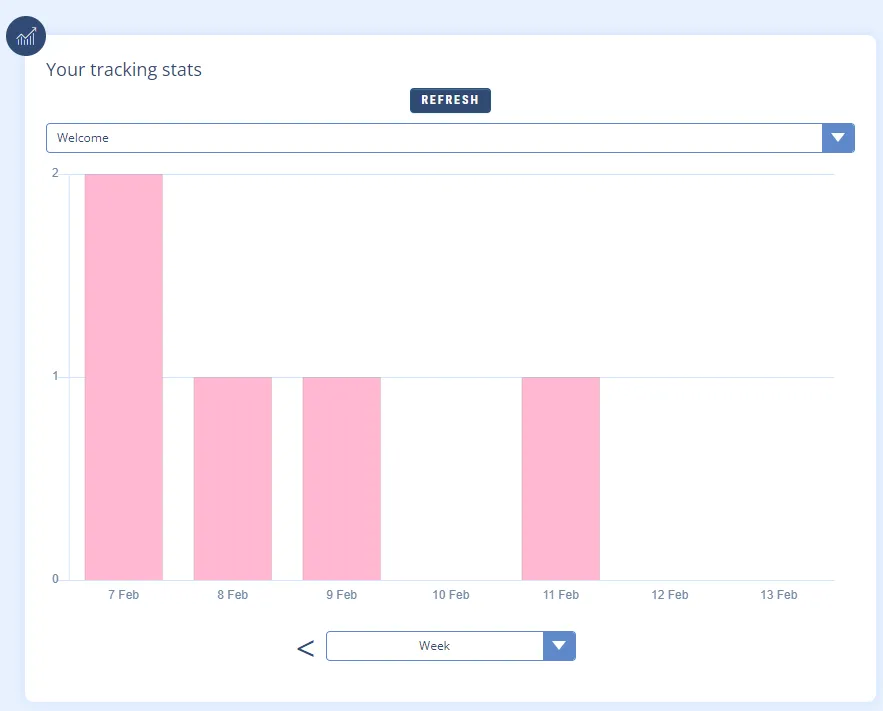
But to follow the evolution of the volume of visits of a sequence, the best is to add Trackers whose graphs will be visible in the Statistics tab.
Sequence of sequences
We will speak here of conversion funnels or Funnels. This feature allows you to have detailed statistics to follow the volume of visits of a sequence (e.g. to know which question of a form users answer).

Tips: The main data in the Statistics tab can be exported to Excel.
PERFORMANCE OF ARTIFICIAL INTELLIGENCE
This is about measuring a crucial element: the efficiency of your chatbot’s AI.
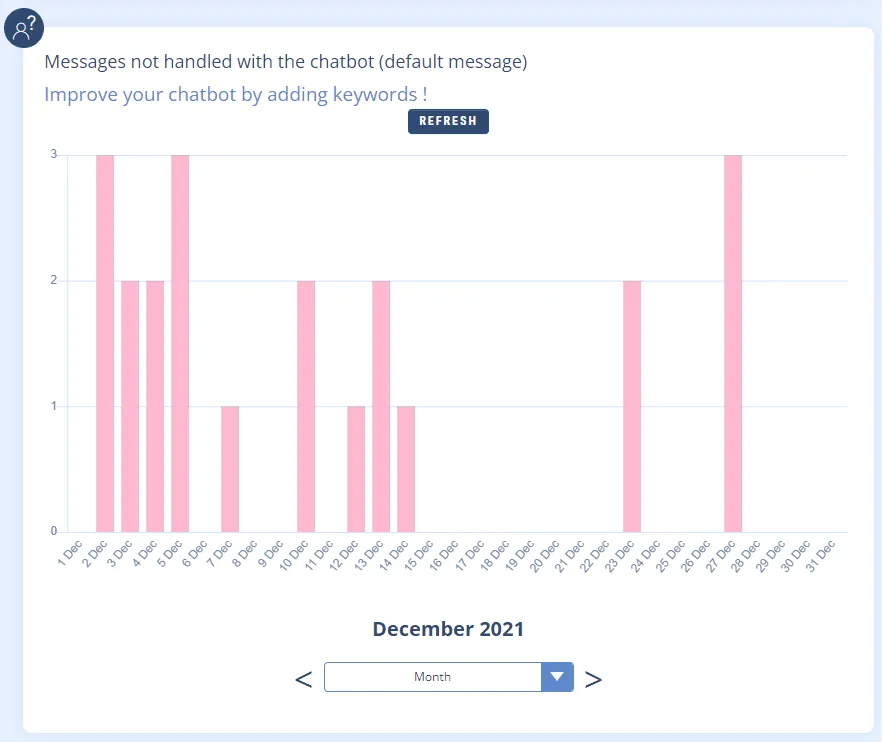
Non-response rate
This graph, which can be found in the Statistics tab, shows the number of times the chatbot has failed to respond to the user. Obviously, this is a statistic that we try to keep as low as possible.
Recurring errors
To find out which requests have set your chatbot at fault, this is done in the AI tab under Recommendation Engine. As the name suggests, not only will you find the details of the requests classified by order of recurrence but also suggestions for improving your AI.
This is where you’ll see if it’s enough to simply add new AI rules or create new content.
► Learn more about the Recommendation Engine
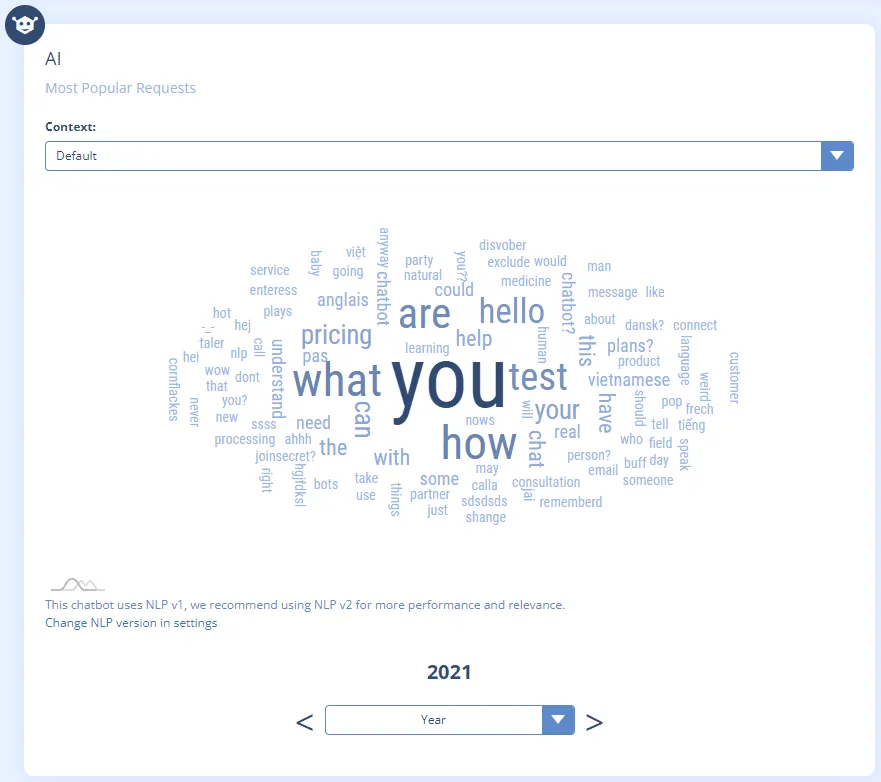
Frequently asked questions
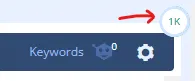
To know the most frequent requests made to your chatbot, Botnation offers a visual solution: the Word Cloud. By hovering your mouse over a word you will know how many times it has been used in the selected time period.
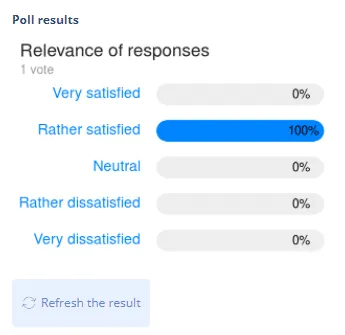
QUALITATIVE INDICATORS
Beyond quantitative indicators, the best way to know if your chatbot is appreciated by your users is to conduct a satisfaction survey. A few questions at the end of the course will give you more information. On Botnation it is very easy to implement thanks to our exclusive survey features.
–
As you can see, Botnation has all the tools you need to analyze your chatbot’s performance and help it grow. Our advice for an optimal chatbot: do this analysis at least once a month.